
What is UV DOAS Method GAS Analyzer
Release time: 2026-11-03
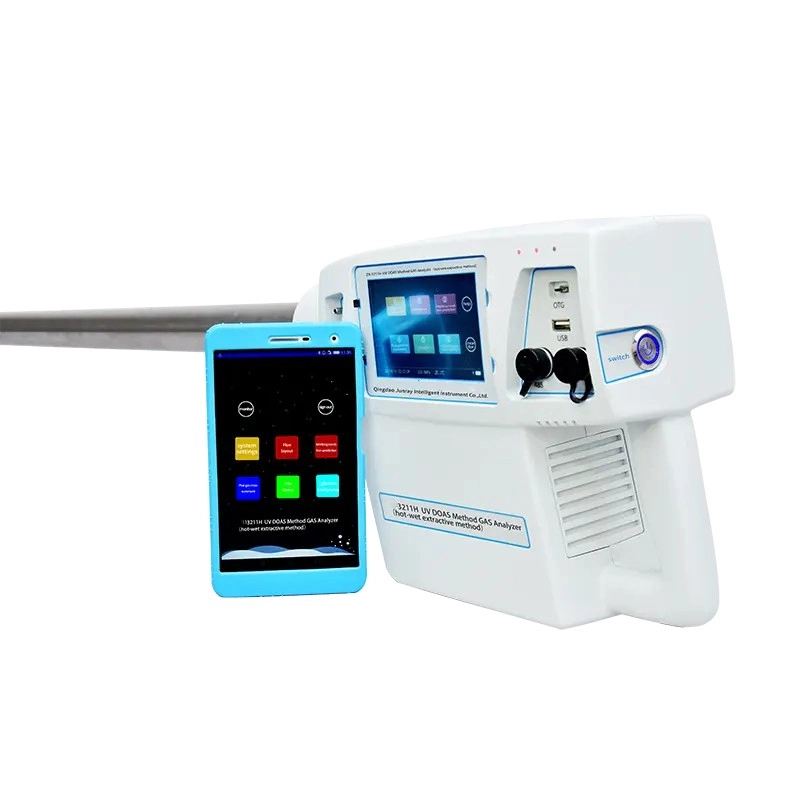
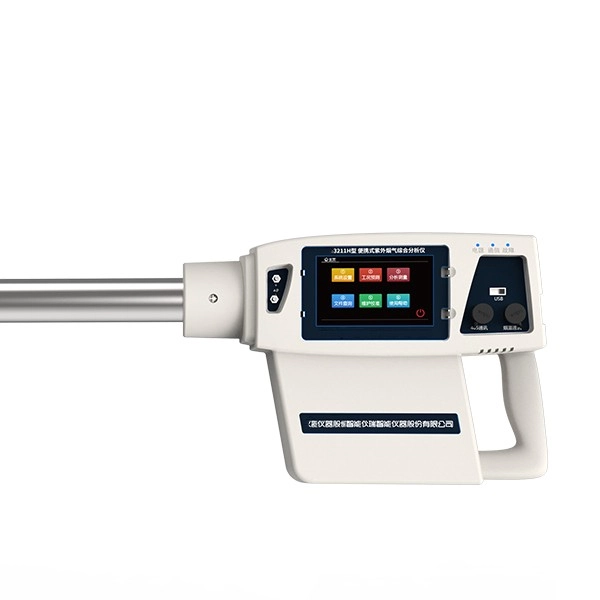
In the modern landscape of industrial compliance and environmental protection, precision in measuring airborne pollutants is non-negotiable. Among the most advanced analytical technologies deployed globally is the UV DOAS Method. Standing for Differential Optical Absorption Spectroscopy, this technique utilizes the ultraviolet light spectrum to detect, identify, and quantify trace gas concentrations with exceptional accuracy.
As industries face increasingly stringent emissions regulations, understanding the mechanics, applications, and advantages of this spectroscopic technology is essential for facility managers, environmental engineers, and regulatory bodies.
The Scientific Foundation of Differential Optical Absorption Spectroscopy
At its core, the technology relies on the interaction between light and matter. When a beam of ultraviolet light passes through a gaseous medium, specific molecules within that gas absorb light at distinct, characteristic wavelengths. This phenomenon is governed by the Beer-Lambert Law, which states that the attenuation of light is directly proportional to the concentration of the absorbing chemical species and the length of the optical path.
However, standard optical absorption can be compromised by broadband interference—such as scattering from particulate matter (dust) or attenuation from optical window contamination. The “Differential” aspect of the UV DOAS Method elegantly solves this problem.
Instead of measuring absolute light intensity, the system analyzes the rapid variations (narrowband absorption) in the absorption spectrum relative to a broader baseline. By mathematically separating the fast-varying absorption features unique to specific target molecules from the slow-varying broadband interference, the instrument isolates the exact chemical fingerprint of the target pollutant. This mathematical filtering allows the analytical instrument to maintain pinpoint accuracy even in harsh, dusty, or high-humidity industrial exhaust stacks.
Core Components of the System Architecture
A high-performance UV-based detection unit is engineered with several critical optoelectronic components, functioning in unison to deliver real-time data.
- Ultraviolet Light Source: Typically a pulsed xenon lamp or a deuterium lamp. These sources emit a highly stable, continuous spectrum of UV light (ranging from 190 nm to 400 nm). Xenon lamps are highly favored for their long operational lifespan and minimal thermal output.
- Optical Measurement Cell (Gas Cell): The chamber where the sample gas interacts with the light beam. High-end models utilize a multiple-reflection pathway (such as a White cell or Herriott cell) to fold the optical path. A longer optical path significantly lowers the detection limit, allowing the system to detect trace gases down to parts-per-billion (ppb) levels.
- Spectrometer: The heart of the unit. The spectrometer utilizes a diffraction grating to separate the incoming light into its constituent wavelengths, much like a prism splitting visible light into a rainbow.
- Photodiode Array (PDA) or CCD Detector: This sensor array captures the dispersed light spectrum simultaneously across all wavelengths. Unlike older scanning monochromators, array detectors capture the entire spectrum instantaneously, enabling real-time, multi-gas measurement.
- Digital Signal Processor: An embedded computing module that runs the complex DOAS algorithms, applying mathematical filters (like Fast Fourier Transforms or polynomial curve fitting) to calculate exact pollutant concentrations.
Target Pollutants and Detection Capabilities
The primary advantage of operating in the ultraviolet spectrum is that water vapor (H2O) and carbon dioxide (CO2)—which heavily absorb infrared light—are entirely transparent to UV light. This eliminates the need for complex moisture removal systems that are mandatory in infrared-based analyzers.
Measurable Gases and Typical Ranges
| Target Gas | Chemical Formula | Typical Detection Range | Primary Industrial Source |
| Sulfur Dioxide | SO2 | 0-10 ppm to 0-5000 ppm | Coal power plants, maritime scrubbers |
| Nitric Oxide | NO | 0-10 ppm to 0-5000 ppm | Combustion engines, boilers |
| Nitrogen Dioxide | NO2 | 0-10 ppm to 0-1000 ppm | Chemical processing, diesel exhaust |
| Ammonia | NH3 | 0-10 ppm to 0-1000 ppm | Fertilizer production, DeNOx slip |
| Hydrogen Sulfide | H2S | 0-50 ppm to 0-1000 ppm | Refineries, biogas plants |
| Benzene/Toluene | C6H6 / C7H8 | 0-5 ppm to 0-500 ppm | Petrochemical manufacturing |
Note: Detection limits are highly dependent on the optical path length of the specific Gas Analyzer model.
Comparative Analysis: Ultraviolet vs. Infrared Technologies
When selecting a continuous emission monitoring system (CEMS), engineers typically choose between UV-based systems and Non-Dispersive Infrared (NDIR) technology. While both serve critical roles, their operational environments often dictate the best choice.
Technology Comparison Matrix
| Feature | UV DOAS Technology | NDIR (Infrared) Technology |
| Moisture Interference | Zero. Water vapor is transparent to UV. | High. H2O absorbs IR light strongly. |
| Sample Conditioning | Minimal. Can measure hot/wet gases directly. | Complex. Requires strict gas cooling/drying. |
| Multi-Gas Capability | Excellent. Measures multiple gases simultaneously. | Limited. Usually requires distinct IR filters per gas. |
| Target Gases | SO2, NO, NO2, NH3, H2S, Aromatics. | CO, CO2, CH4 (Hydrocarbons). |
| Maintenance Burden | Low (no moving parts in the spectrometer). | Moderate to High (chopper motors, coolers). |
Because NO and NO2 can be measured simultaneously without cross-interference, this spectroscopic technology eliminates the need for NOx converters (which turn NO2 into NO for older analyzers), simplifying the mechanical design and reducing failure points.
Key Industrial Applications
The robust nature and high precision of this methodology have led to its adoption across heavily regulated industrial sectors globally.
1. Thermal Power Plants and Incinerators
Fossil-fuel power plants and municipal solid waste incinerators generate massive volumes of flue gas containing SO2 and NOx. Ultraviolet systems are deployed directly in the stack or via extractive heated lines to provide real-time compliance data to environmental protection agencies, ensuring the facility does not exceed legal emission thresholds.
2. Maritime Exhaust Gas Cleaning Systems (Scrubbers)
Under the IMO 2020 regulations, marine vessels must strictly limit their sulfur emissions. Ships utilizing exhaust gas scrubbers rely on this monitoring device to continuously verify the ratio of SO2/CO2 in the exhaust plume. The high humidity of scrubber exhaust makes UV detection the only viable, reliable option, as water vapor does not skew the readings.
3. DeNOx (SCR/SNCR) Process Control
In Selective Catalytic Reduction (SCR) processes, ammonia (NH3) is injected into exhaust streams to neutralize NOx. If too much ammonia is injected, unreacted NH3 escapes into the atmosphere—a phenomenon known as “ammonia slip.” By continuously measuring both NOx and trace NH3 simultaneously, operators can dynamically adjust injection rates, saving chemical costs and preventing secondary pollution.
4. Chemical and Petrochemical Manufacturing
Refineries emit a complex mixture of hydrocarbons and volatile organic compounds (VOCs). Systems configured for the deep-UV spectrum can detect toxic aromatics like benzene, toluene, and xylene (BTX) with parts-per-billion sensitivity, providing early warning for leaks or process inefficiencies.
Operational Best Practices and Maintenance Strategy
While these devices are renowned for their stability and lack of moving parts, maintaining peak analytical performance requires a structured maintenance regimen.
- Zero Calibration Checks: Establish a routine baseline by purging the measurement cell with pure nitrogen or zero-air weekly. This corrects for any gradual electronic drift or minor optical degradation.
- Span Calibration: Introduce a certified calibration gas of known concentration (e.g., exactly 200 ppm of SO2) monthly to verify the slope of the measurement curve.
- Optical Cleaning: Industrial sample gases carry soot and particulate matter. Even with high-efficiency sample conditioning filters, microscopic dust can accumulate on the cell windows. Routine cleaning of the optical lenses with spectroscopic-grade ethanol ensures maximum light transmission.
- Lamp Replacement: Xenon pulse lamps generally degrade after 3 to 5 years of continuous pulsing. Monitoring the lamp’s light energy output through the system’s diagnostic software allows for preemptive replacement before failure occurs.
Understanding the mechanics of these gas measurement systems provides a clear view into how modern industries achieve stringent environmental compliance.
FAQ
1. Why doesn’t water vapor interfere with UV DOAS measurements?
Water vapor (H2O) molecules only absorb light energy in the infrared and microwave regions of the electromagnetic spectrum. In the ultraviolet spectrum (190 nm to 400 nm) used by this instrument, water vapor is completely optically transparent, meaning the light passes through it without attenuation. This eliminates the false-positive readings common in older infrared analyzers.
2. Can a single system measure both SO2 and NOx simultaneously?
Yes. The photodiode array spectrometer captures a wide band of ultraviolet light all at once. Because SO2, NO, and NO2 each have distinct, non-overlapping absorption signatures (fingerprints) at different wavelengths within that band, the system’s mathematical algorithms can isolate and quantify all three gases simultaneously from a single optical measurement.
3. What is the difference between extractive and in-situ installations?
In an extractive setup, a pump pulls a sample of the gas out of the smokestack, routes it through heated sample lines, and delivers it to the analyzer housed in a climate-controlled cabinet. In an in-situ setup, the optical cell or a probe is inserted directly inside the smokestack, measuring the gas as it flows by without extracting it. Extractive systems are easier to calibrate and maintain, while in-situ systems offer faster response times.